
Trend lines and channels are indispensable tools for traders seeking to understand market direction, confirm reversals, and predict price targets. These tools allow traders to visually assess the market’s strength and spot key support and resistance areas, making them highly valuable for both novice and experienced traders.
Trend Lines: A Foundation for Price Movement
Trend lines are straight lines drawn on price charts that represent the prevailing direction of a market or asset. They help visualize whether a market is in an uptrend, downtrend, or moving sideways. The basic assumption in technical analysis is that prices follow trends. Identifying these trends early can provide traders with significant advantages.
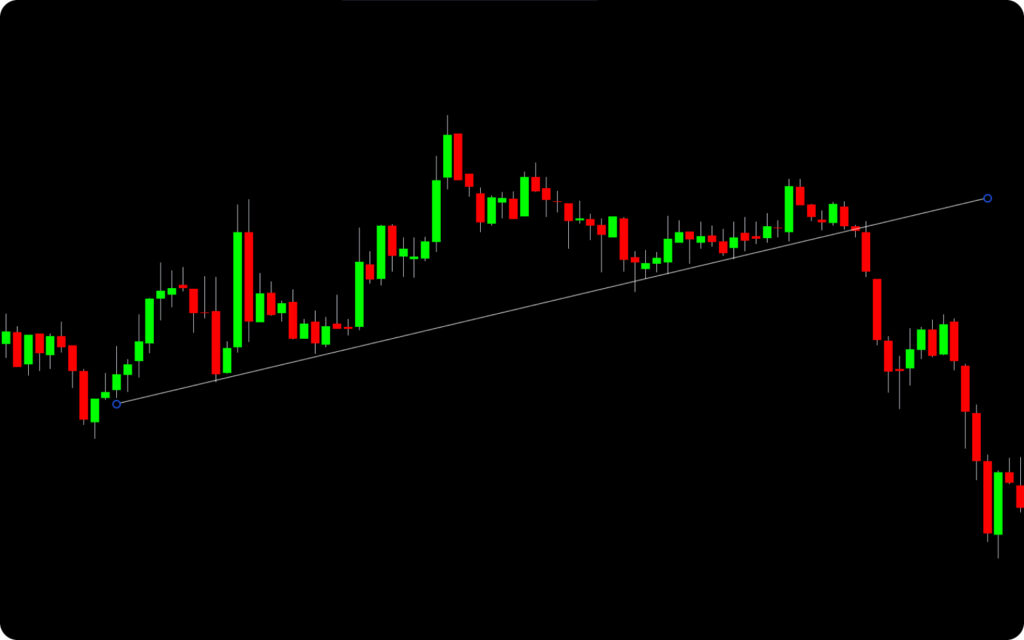
Uptrend Line
An uptrend line connects two or more lows in the price action. This line slopes upwards and serves as a level of support where prices typically rebound. An intact uptrend line suggests that buyers continue to step in when prices decline, reinforcing bullish sentiment. A break below this line often signals that the uptrend is weakening and a possible reversal is on the horizon.
Downtrend Line
A downtrend line is drawn by connecting two or more highs and has a downward slope. It acts as resistance, showing that sellers dominate and push prices lower each time they attempt to rise. A break above a downtrend line often signals a shift in market momentum, with potential for a bullish reversal.
Importance of Trend Line Steepness
The steepness or angle of the trend line is important for understanding the strength of the trend. A line that is too steep indicates an unsustainable rate of price increase or decline, while a line that is too flat may suggest weak momentum. Although a 45-degree angle is often cited as ideal, this rule isn’t universal—it is context-dependent. The market’s behavior and the asset’s volatility should guide how trend lines are interpreted.
Multiple Touches for Validation
A valid trend line typically requires at least three touches to confirm its significance, although some may argue you can identify potential trend lines forming with two touches. The more times the price tests the trend line without breaking it, the more reliable the trend line becomes.
Channels: Price Movement within Boundaries
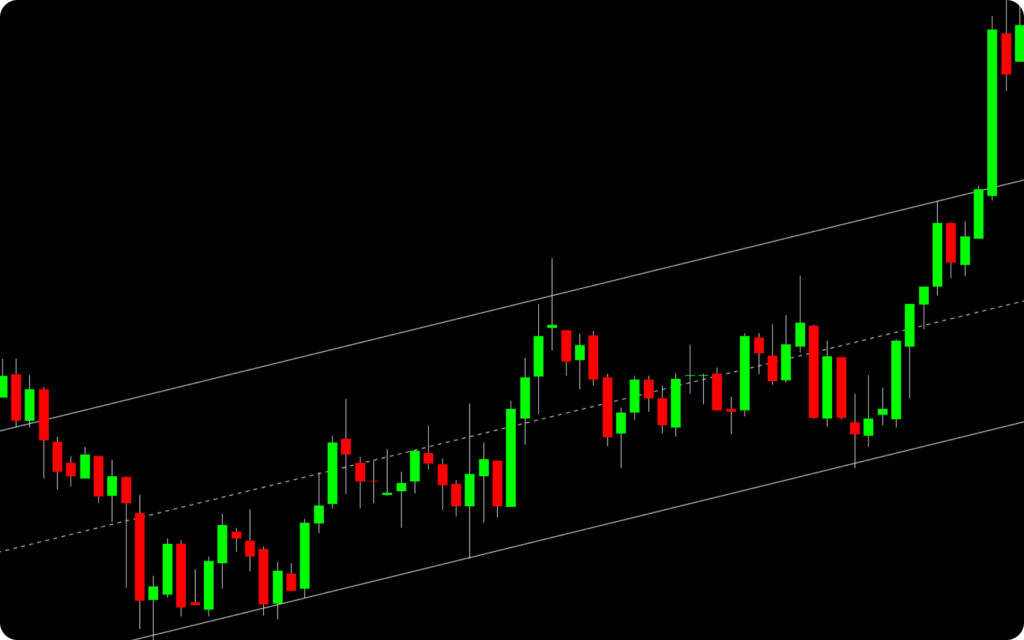
They are formed by two parallel trendlines—one connecting the highs and the other connecting the lows—encasing the price action within a defined range. The upper boundary serves as resistance, while the lower boundary acts as support. Understanding price channels can help traders spot trends, recognize potential breakouts, and identify key areas for entry and exit points.
There are three primary types of price channels:
Ascending (Bullish) Channel: This is formed during an uptrend, where both the support and resistance lines slope upwards. The price moves between these lines, with traders often buying near the lower boundary (support) and selling near the upper boundary (resistance). A break above the upper trendline signals accelerating bullish momentum.
Descending (Bearish) Channel: This forms during a downtrend, where both trendlines slope downward. The price moves within this declining range, with traders shorting near the upper boundary and covering near the lower boundary. A break below the lower trendline suggests further weakness and continuation of the downtrend.
Horizontal Channel (Sideways): Also known as a consolidation range, the trendlines are flat, and the price moves sideways between support and resistance levels. Traders tend to buy at the lower boundary and sell at the upper boundary, waiting for a decisive breakout in either direction to confirm a new trend.
Importance of Price Channels
Price channels help traders:
- Identify Trends: Channels highlight whether an asset is trending upward, downward, or sideways, making it easier to set strategic buy or sell points.
- Spot Reversals: A break outside the channel—either above resistance or below support—often signals a trend reversal or acceleration.
- Manage Risk: The upper and lower boundaries of a channel act as predefined zones where traders can place stop-losses, minimizing risk if the market moves against them.