Technical indicators are powerful tools used by traders and analysts to interpret market behavior and make informed trading decisions. These indicators are derived from historical price and volume data, helping traders identify trends, measure momentum, and predict potential reversals. By providing visual cues and data insights, technical indicators play an essential role in technical analysis, complementing chart patterns and other market observations.
The History of the Relative Strength Index (RSI)
The RSI was developed by J. Welles Wilder Jr., a pioneer in the field of technical analysis, who introduced it in his book New Concepts in Technical Trading Systems. Alongside the RSI, Wilder introduced other influential tools, including the Average True Range (ATR), the Average Directional Index (ADX), and the Parabolic SAR. These indicators have since become staples for traders worldwide, with the RSI standing out for its simplicity and reliability.

Understanding the RSI
The Relative Strength Index (RSI) measures the strength or weakness of an asset by comparing its recent price gains to its recent price losses over a specified time frame. It oscillates between 0 and 100, appearing as a line graph on trading platforms.
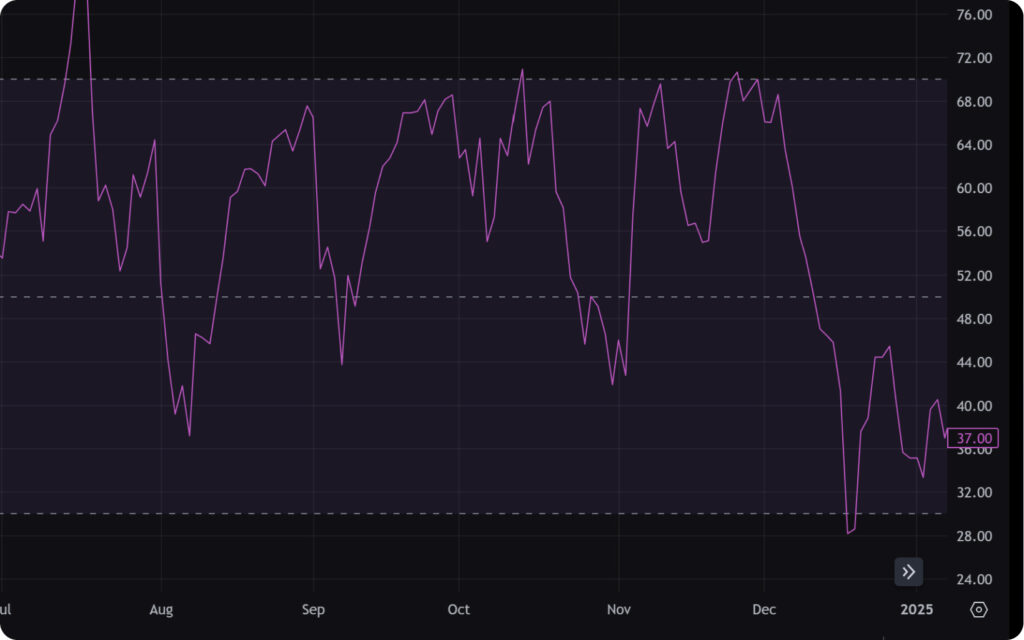
Key RSI Levels:
- Above 70: Overbought (OB) – A potential reversal or price correction might occur.
- Below 30: Oversold (OS) – Indicates that the asset may be undervalued, with potential for a bounce.
- Between 30 and 70: Neutral zone – Prices are generally stable.
- Midline at 50: A dividing point; readings above 50 suggest bullish momentum, while readings below indicate bearish momentum.
Wilder originally set the RSI’s default period to 14, suitable for daily charts. Traders often tweak these settings based on their strategies:
- Lower Periods (e.g., 7 or 10): Generate more frequent signals but with reduced reliability.
- Higher Periods (e.g., 20 or 28): Smooth out signals, offering fewer but more reliable indications.
- Adjusting Overbought/Oversold Levels: Some traders use 80 and 20 instead of 70 and 30 to reduce false signals, especially in trending markets where RSI can remain in OB or OS zones for extended periods.
How RSI Helps Traders
The RSI is highly versatile and can assist in:
- Identifying Trends: Understanding the market direction.
- Measuring Trend Strength: Assessing the momentum behind price movements.
- Spotting Overbought or Oversold Conditions: Determining if an asset is trading at extreme levels.
- Detecting Potential Reversals: Identifying divergence signals that hint at market turning points.
Trading Strategies Using RSI
Buy Signals:
- Oversold Reversal: Go long when RSI moves above 30, signaling a potential upward momentum.
- Confirmation Trade: Add to the position when RSI crosses above 50, indicating sustained bullish momentum.
- Bullish Divergence: Look for a higher low in the RSI while the price forms a lower low, signaling a potential trend reversal upward.
Sell Signals:
- Overbought Reversal: Go short when RSI moves below 70, indicating potential bearish momentum.
- Confirmation Trade: Add to the position when RSI crosses below 50, reinforcing bearish strength.
- Bearish Divergence: Look for a lower high in the RSI while the price forms a higher high, signaling a potential downward reversal.
Enhancing RSI with Other Tools
The RSI works effectively in combination with other technical tools:
- Trend Lines and Moving Averages: RSI levels often align with trendline support or resistance zones, enhancing the reliability of signals.
- Divergence Detection: Coupling RSI divergence with other indicators can strengthen trend reversal predictions.
At thePropTrade, we incorporate RSI into our trading strategies across all timeframes and asset classes, leveraging it to confirm trends, anticipate reversals, and enhance overall market analysis.